Snake bite first aid is crucial for preventing severe outcomes. Immediate action‚ proper techniques‚ and awareness can save lives. It involves immobilization‚ pressure bandages‚ and seeking medical help promptly. Always stay calm and follow guidelines.
1.1 Importance of Immediate Action
Immediate action is essential in snake bite first aid to prevent venom from spreading and reducing the risk of severe complications. Delays in treatment can lead to systemic envenoming‚ which may result in serious health issues or even death. Quick intervention helps minimize the amount of venom absorbed into the bloodstream. Key steps like immobilization and applying a pressure bandage should be done promptly to slow venom movement. Additionally‚ keeping the victim calm is crucial‚ as increased heart rate can accelerate venom spread. Immediate action also involves seeking medical help without delay‚ especially in remote areas where access to antivenom may be limited. Every minute counts‚ as early administration of antivenom significantly improves outcomes. Understanding the urgency of these steps can make a difference in saving lives and preventing long-term health effects.
1.2 Overview of First Aid Methods
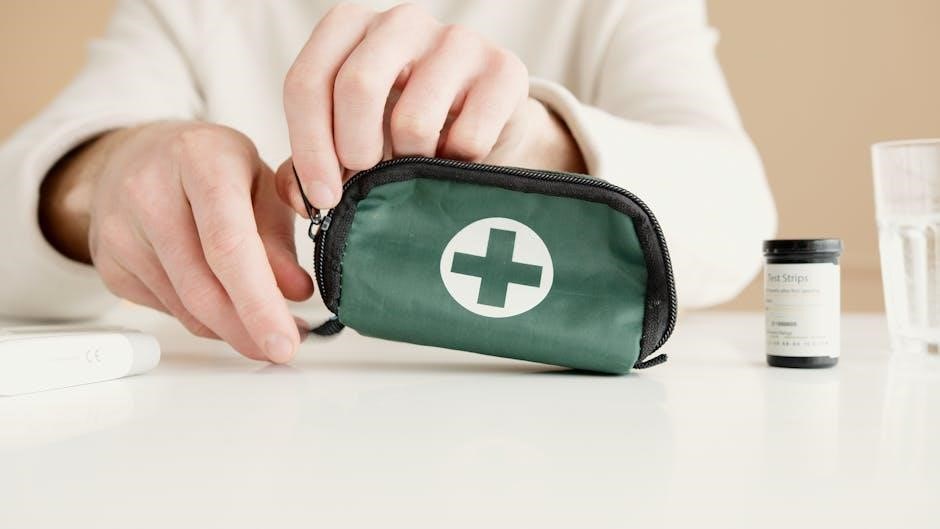
Effective first aid for snake bites involves several key steps to manage the situation and reduce the risk of severe envenoming. Immobilization of the affected limb is crucial to slow the spread of venom through the bloodstream. Applying a pressure bandage or elastic wrap firmly‚ but not tightly‚ can help constrict blood flow and limit venom movement. Keeping the victim calm and still is also vital‚ as increased heart rate can accelerate venom circulation. Additional measures include cleaning the bite area with soap and water to prevent infection and monitoring for signs of envenoming‚ such as pain‚ swelling‚ or difficulty breathing. It is essential to avoid outdated practices like cutting the wound or sucking out venom‚ as these methods are ineffective and potentially harmful.
These first aid techniques aim to stabilize the victim and buy time until professional medical care is available. Prompt action can significantly improve outcomes and prevent long-term health complications.
Understanding Snake Venom
Snake venom is a complex mixture of toxins that can cause systemic effects. Different species produce venoms with varying potencies and effects‚ impacting the body differently. Understanding venom types aids treatment.
2.1 Types of Venom and Their Effects
Snake venoms are categorized into hemotoxic‚ neurotoxic‚ and cytotoxic types. Hemotoxic venom attacks blood and organs‚ causing internal bleeding and kidney failure. Neurotoxic venom affects the nervous system‚ leading to paralysis and respiratory failure. Cytotoxic venom damages tissues locally‚ causing severe swelling and necrosis. Each type requires tailored first aid and medical treatment to effectively counteract its effects. Understanding these differences is crucial for proper snake bite management and treatment.
2.2 How Venom Affects the Body
Snake venom‚ once injected‚ rapidly enters the bloodstream and spreads throughout the body. It disrupts normal physiological functions‚ leading to systemic complications. Hemotoxic venom damages blood vessels‚ causing internal bleeding‚ organ failure‚ and renal shutdown. Neurotoxic venom paralyzes the nervous system‚ impairing respiratory and cardiac functions. Cytotoxic venom destroys tissue‚ resulting in severe swelling and necrosis. The effects can escalate quickly‚ making immediate first aid critical. Venom interference with blood clotting and muscle function can lead to further complications. Prompt medical intervention‚ including antivenom administration‚ is essential to counteract these effects and prevent long-term damage or fatalities. Understanding how venom impacts the body emphasizes the importance of rapid response and proper first aid techniques to mitigate severe outcomes.

Prevention and Awareness
Prevention and awareness are key to reducing snake bite incidents. Education on recognizing venomous species and avoiding risky areas is vital. Community training and school programs enhance preparedness and safety measures significantly.
3.1 Tips for Avoiding Snake Encounters
To minimize the risk of snake encounters‚ stay on marked trails and avoid tall grass or brush. Wear protective clothing‚ including long pants and boots‚ when walking in snake-prone areas. Use a flashlight at night to spot snakes. Never reach or step into dark or hidden spaces without checking first. Keep your surroundings clean to reduce rodent activity‚ which attracts snakes. Be cautious when handling rocks or logs‚ as snakes often rest beneath them. Avoid touching or handling any snake‚ even if it appears harmless. Educating yourself about local snake species and their habitats can also help prevent unexpected encounters. By adopting these practices‚ you significantly reduce the likelihood of encountering a venomous snake.
3.2 The Role of Education in Prevention
Education plays a vital role in preventing snake bites by equipping individuals with knowledge on safety measures and first aid. Teaching communities about snake habitats‚ behavior‚ and risks encourages proactive steps to avoid encounters. Schools and local organizations should incorporate snake bite prevention into their curriculum‚ emphasizing the importance of staying calm‚ not panic‚ and seeking immediate medical help. Workshops and training sessions can demonstrate practical steps like wearing protective clothing and using tools to move debris safely. Additionally‚ educating the public on the dangers of traditional remedies‚ such as cutting or sucking the wound‚ can prevent further harm. By fostering awareness and promoting best practices‚ education becomes a powerful tool in reducing snake bite incidents and improving outcomes when they do occur.
Immediate Response to a Snake Bite
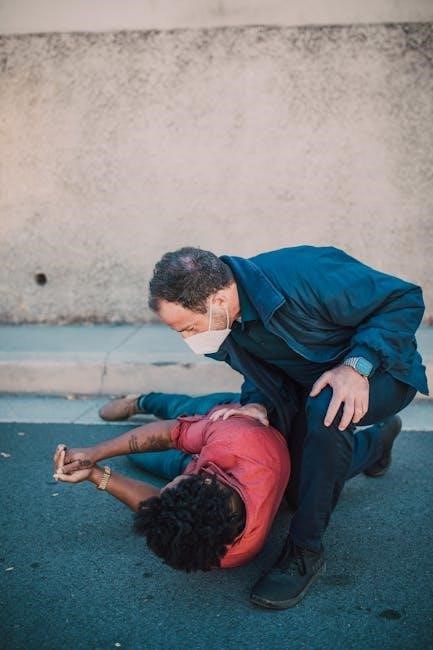
Stay calm and reassure the victim. Immobilize the affected limb and apply a firm pressure bandage. Avoid washing the wound or using tourniquets. Seek urgent medical attention immediately.
4.1 Steps to Take Right After the Bite
Stay calm and reassure the victim to prevent panic. Immobilize the affected limb below heart level to slow venom spread. Apply a firm‚ elastic pressure bandage (minimum 7.5 cm wide) to the entire limb at 40 mmHg for arms or 55 mmHg for legs. Avoid washing the wound‚ sucking out venom‚ or using a tourniquet. Gently remove any constricting items near the bite. Assess the situation‚ noting the time of the bite and any symptoms. Call emergency services immediately if severe symptoms arise. Stay with the victim until medical help arrives and provide any relevant information to healthcare providers;
4.2 Assessing the Situation
Assessing the situation after a snake bite is critical to determine the severity and appropriate response. Stay calm and evaluate the victim for signs of envenoming‚ such as pain‚ swelling‚ or difficulty breathing. Note the time of the bite and any visible symptoms. Check if the snake can be safely identified‚ as this aids in treatment. If the victim is in a remote area‚ call for emergency services immediately. Monitor the victim’s condition closely‚ as symptoms can escalate rapidly. Ensure the victim remains still and avoid any unnecessary movement; Do not delay seeking professional medical help‚ as antivenom is the most effective treatment for venomous bites. Keep the victim calm and reassured until medical assistance arrives. Remember‚ not all bites are venomous‚ but all should be treated with caution.
Identifying the Snake Species
Identifying the snake species is essential for effective treatment. Common venomous snakes include cobras‚ vipers‚ and rattlesnakes. Knowing the species helps determine the appropriate antivenom and first aid approach needed.
5.1 Common Venomous Snakes and Their Characteristics
Identifying venomous snakes is crucial for effective first aid. Common species include cobras‚ known for their hood‚ and vipers‚ recognized by their triangular heads. Rattlesnakes‚ with their distinct rattle‚ are also dangerous. Each species has unique features‚ such as color patterns or behavior‚ that aid in identification. For instance‚ coral snakes are identified by their red‚ yellow‚ and black bands. Understanding these characteristics helps in applying the correct treatment. Proper identification ensures the administration of specific antivenom‚ which is vital for neutralizing venom. Misidentification can lead to ineffective treatment‚ emphasizing the need for accurate knowledge. Education and awareness of local venomous species are essential for preventing and managing snake bites effectively.
5.2 The Importance of Identification for Treatment
Accurate identification of the snake species is critical for effective treatment. Different venoms require specific antivenom‚ and misidentification can lead to inappropriate therapy. Venom composition varies among species‚ causing unique systemic effects. For example‚ neurotoxic venom affects the nervous system‚ while hemotoxic venom impacts blood and organs. Knowing the snake’s characteristics ensures targeted medical intervention. Identification also helps determine the severity of the bite and whether antivenom is necessary. In some cases‚ bites may not require antivenom‚ avoiding potential side effects. Prompt and precise identification by healthcare professionals or snake experts is essential for optimal outcomes. This step ensures that treatment is tailored to the specific venom‚ enhancing efficacy and reducing risks. Therefore‚ identification is a cornerstone of snake bite management‚ directly influencing patient recovery and survival rates.
Managing Symptoms and Pain
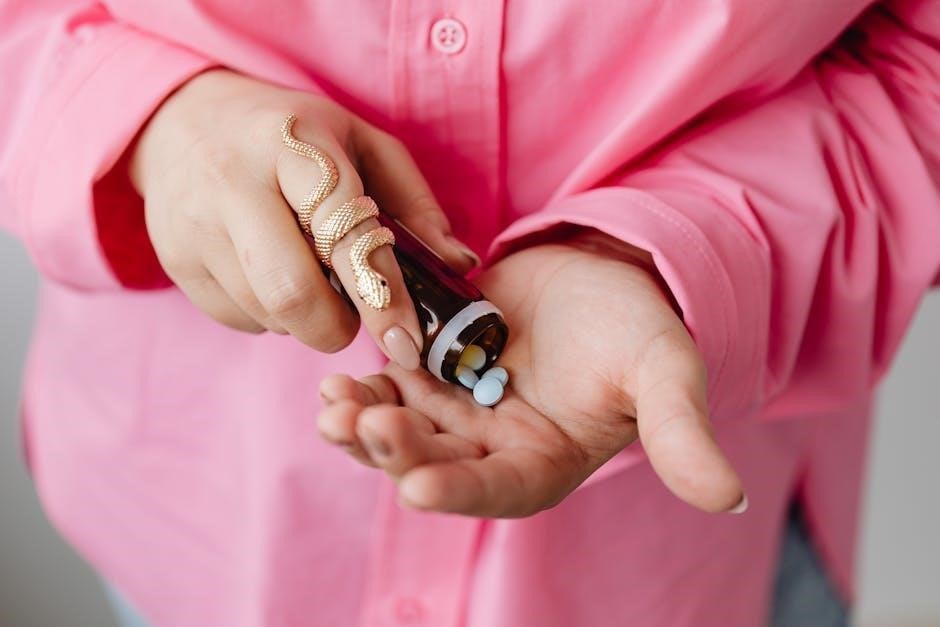
Keep the victim calm to slow venom spread. Monitor for swelling‚ pain‚ or breathing difficulties. Administer pain relievers like acetaminophen if advised‚ but avoid aspirin or ibuprofen. Seek medical help immediately.
6.1 Recognizing Early Signs of Envenoming
Early signs of envenoming may include localized pain‚ swelling‚ or redness at the bite site. Systemic symptoms can develop rapidly‚ such as nausea‚ dizziness‚ or difficulty breathing. Severe cases may lead to neurological effects like drooping eyelids or slurred speech. It’s crucial to monitor the victim closely for these indicators‚ as they signal the need for urgent medical intervention. Recognizing these signs promptly can significantly improve outcomes‚ ensuring timely administration of antivenom and other treatments. Always prioritize professional medical care over home remedies to address potential systemic envenoming effectively.
6.2 Administering First Aid for Symptoms
Administering first aid for snake bite symptoms involves staying calm and avoiding harmful practices like tourniquets or sucking out venom. Keep the victim still and immobilize the affected limb to slow venom spread. Apply a pressure bandage firmly but not too tight‚ covering the entire limb. Monitor vital signs and watch for systemic symptoms such as nausea‚ dizziness‚ or difficulty breathing. Do not administer painkillers or alcohol‚ as they can worsen the situation. Reassure the victim to prevent panic‚ which can increase heart rate and venom circulation. If possible‚ note the snake’s appearance for identification without risking another bite. These steps help manage symptoms until professional medical care is available‚ ensuring the best chance of recovery and minimizing potential complications from envenoming.
Immobilization Techniques
Proper immobilization techniques involve keeping the affected limb still and secure. Use a splint or sling to restrict movement‚ reducing venom circulation. Avoid tight constraints that could impair blood flow.
7.1 Proper Methods to Immobilize the Affected Limb
Proper immobilization of the bitten limb is essential to slow venom spread. Use a rigid splint or sling to keep the limb straight and immobile. Avoid using tight bandages that may restrict blood flow. If the bite is on an arm‚ immobilize it with a sling‚ keeping it below heart level. For legs‚ use a sturdy splint that prevents bending. Do not apply tourniquets or ice‚ as these can worsen the situation. Immobilization helps reduce muscle movement‚ minimizing venom circulation. Keep the victim calm and still during transport to medical care. Proper immobilization techniques should be learned through first aid training to ensure effective application in emergencies.
7.2 Benefits of Immobilization in Reducing Venom Spread
Immobilizing the affected limb after a snake bite significantly slows venom circulation‚ reducing systemic spread and tissue damage. By limiting movement‚ the venom’s absorption into the bloodstream is delayed‚ providing crucial time for medical intervention. This method is especially effective for neurotoxic and hemotoxic venoms‚ which can cause rapid deterioration. Studies show that immobilization can reduce the need for antivenom and lower the risk of severe complications. Proper immobilization techniques‚ such as using splints or slings‚ ensure the limb remains stable‚ preventing unnecessary muscle contractions that could disperse venom faster. This first aid measure is widely recommended and supported by medical guidelines as a critical step in managing snake bites effectively until professional help is available.

Application of Pressure Bandage
A broad elastic bandage (minimum 7.5 cm wide) is applied firmly to the bitten limb‚ maintaining pressure of 40 mmHg for arms and 55 mmHg for legs. This slows venom spread effectively. The bandage should not be removed until medical assessment is complete‚ ensuring optimal first aid efficacy.
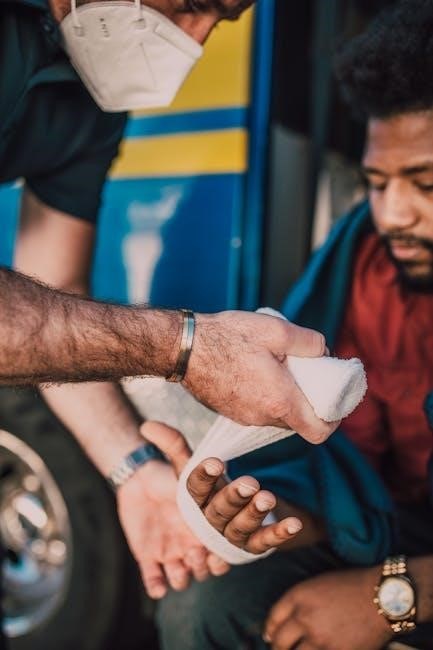
8.1 How to Apply a Pressure Bandage Correctly
To apply a pressure bandage for a snake bite‚ use a broad‚ elastic bandage (at least 7.5 cm wide). Start at the bite site and wrap upwards‚ covering the entire limb firmly. Apply pressure of 40 mmHg for arms and 55 mmHg for legs. Ensure the bandage is snug but not overly tight‚ as this can restrict blood flow. Avoid leaving loose areas‚ as this reduces effectiveness. The bandage should immobilize the limb while slowing venom spread. Do not remove the bandage until medical professionals assess the patient. Proper application is critical to delay envenoming effects and support treatment. Follow guidelines to ensure optimal first aid. Always prioritize professional medical care after applying the bandage.
8.2 Maintaining the Bandage Until Medical Help Arrives
Maintaining the pressure bandage is critical until medical assistance arrives. Ensure the bandage remains tight and intact to slow venom spread. Avoid adjusting or loosening it‚ as this can disrupt its effectiveness. Monitor the victim for signs of distress or worsening symptoms‚ such as difficulty breathing or increased pain. Keep the affected limb immobilized and at heart level to reduce venom circulation. Do not remove the bandage unless instructed by medical professionals‚ as premature removal can lead to rapid envenoming. Stay with the victim to provide reassurance and prevent unnecessary movement. If the bandage begins to feel too tight or causes discomfort‚ do not alter it—wait for medical help. Properly maintaining the bandage significantly improves treatment outcomes and supports the effectiveness of subsequent medical interventions.
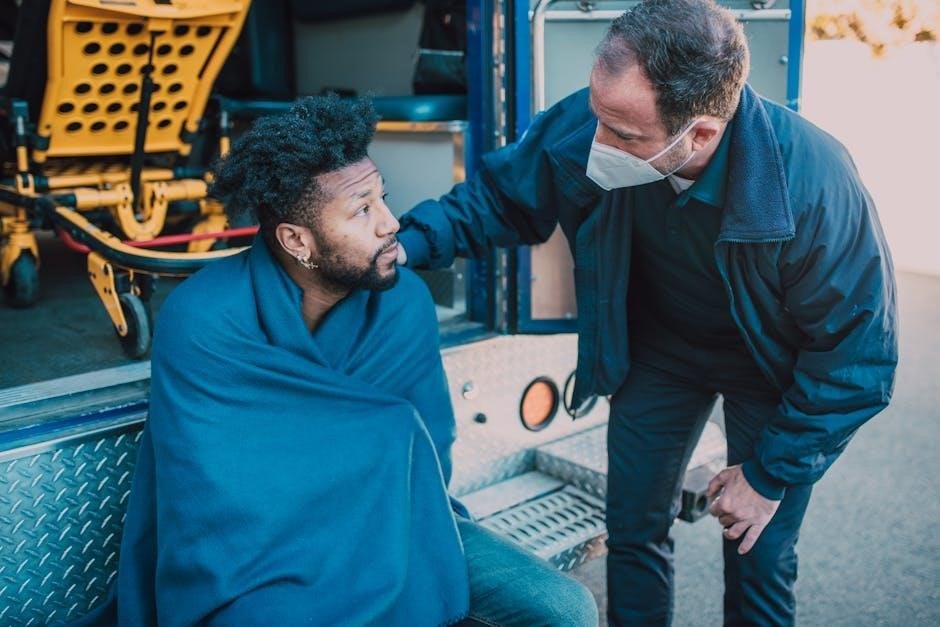
Seeking Medical Assistance
Seek immediate medical help for snake bites‚ as prompt treatment is vital. Trained professionals can administer antivenom‚ the only effective antidote‚ ensuring timely and appropriate care to prevent severe outcomes.
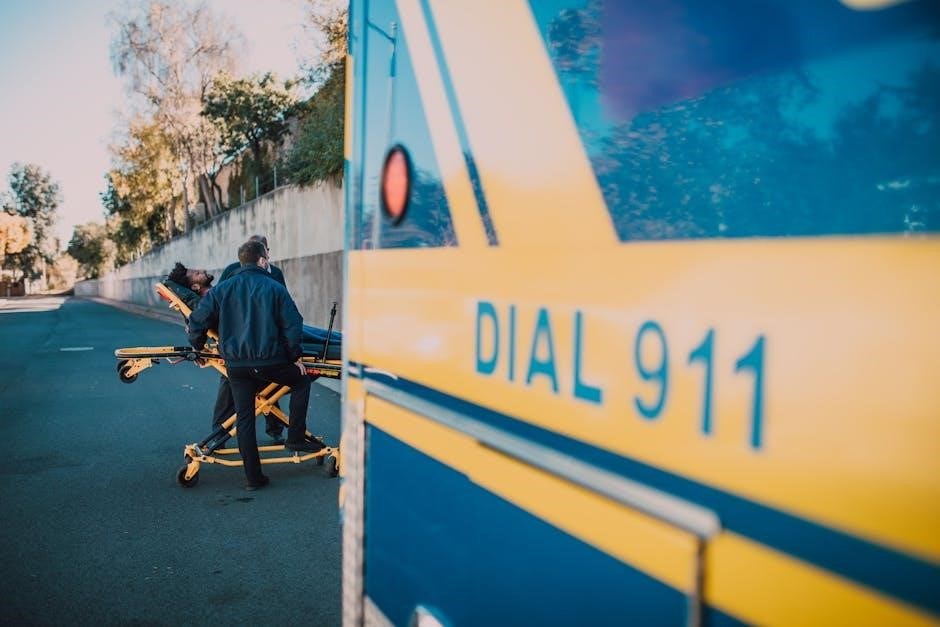
9.1 When to Call Emergency Services
Call emergency services immediately if a snake bite occurs‚ especially in remote areas. Early medical intervention is crucial‚ as antivenom is the only effective treatment for venomous bites. Prompt action ensures better outcomes and prevents complications. Always prioritize urgent care to save lives.
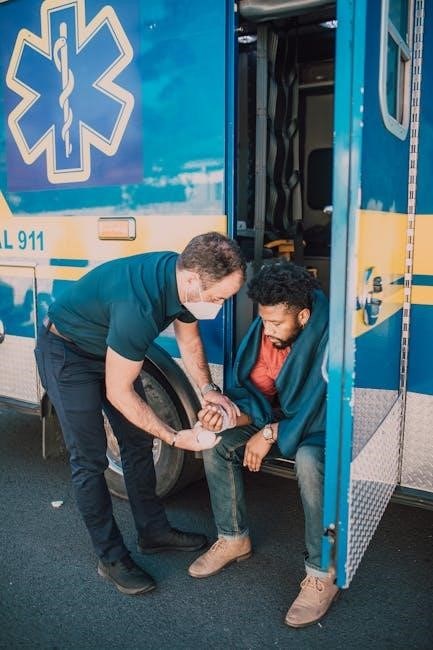
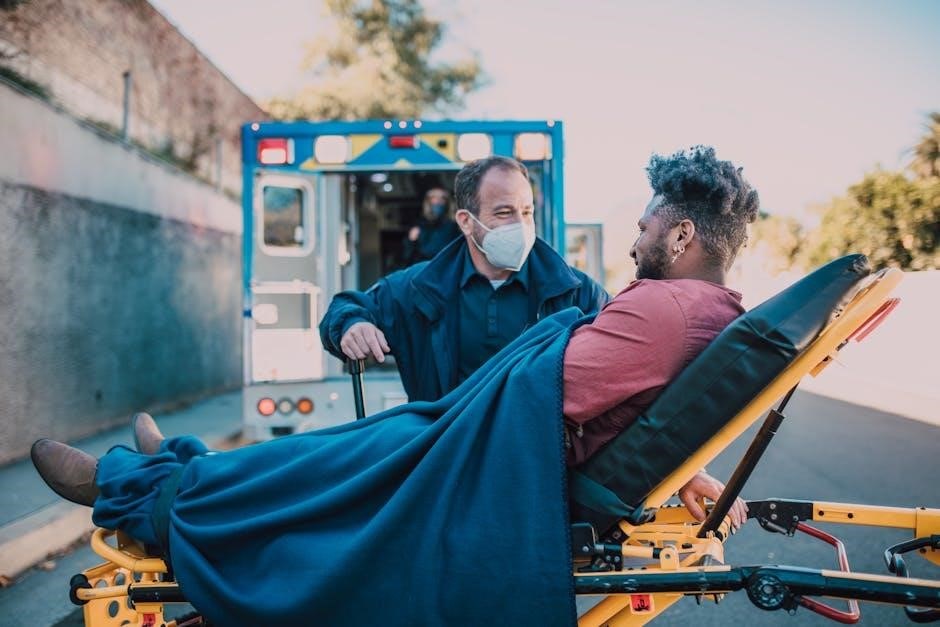
9.2 Transporting the Victim Safely
Transporting a snake bite victim safely is critical to prevent further complications. Keep the affected limb immobilized and avoid unnecessary movement. Use a stretcher if available to maintain stability. Do not delay seeking medical help‚ especially in remote areas where air evacuation may be required. Ensure the victim remains calm during transport to slow venom spread; Avoid applying pressure or moving the limb excessively. If emergency services are called‚ follow their instructions precisely. In rural or remote locations‚ air medical emergency pickups are often necessary for timely treatment. Always prioritize rapid and gentle transportation to a medical facility equipped to handle snake bites. This ensures the victim receives antivenom and expert care promptly‚ improving recovery chances.
Antivenom and Treatment
Antivenom is the most effective treatment for snake bites‚ countering venom’s systemic effects. Administered intravenously‚ it neutralizes circulating toxins. Dosage depends on bite severity and patient’s condition. Early administration improves outcomes. Hospitals stock antivenom specific to common species. Supportive care includes monitoring vital signs and managing symptoms. Prompt medical intervention ensures optimal recovery. Always seek professional treatment immediately‚ as delays can worsen prognosis. Antivenom is essential for severe envenoming cases‚ making it a critical component in snake bite management protocols.